
A Tour of the DollhouseMCP Console
The local web console is one of the fastest ways to understand what DollhouseMCP is doing on your machine, what is installed, and what your active elements are allowed to do.
TL;DR
Run this in a terminal:
npx @dollhousemcp/mcp-server@latest --web
That launches the local DollhouseMCP console and prints the local console URL in your terminal. From there you get five major views:
- Setup for guided install across popular MCP clients
- Portfolio for browsing your local Dollhouse elements visually
- Logs for real-time operational visibility
- Metrics for server health, MCP-AQL usage, cache, and Gatekeeper trends
- Permissions for seeing the current policy state and live decisions
This post is a quick tour of those tabs and why they matter.
All of the screenshots below were refreshed from the current 2.0.15 console so the UI matches what is live now.
Setup: Guided Install From One Place
The Setup tab is the first thing many people will want from the console. Instead of hunting through config files for each client, the setup wizard gives you one place to connect Claude Desktop, Claude Code, Cursor, VS Code, Codex, Gemini CLI, Windsurf, Cline, and LM Studio.
Based on the public quick-start docs, the setup flow supports:
- auto-updating installs using
npx @latest - pinned-version installs when you want reproducible setups
- one-click install where the platform supports it
- copyable manual config blocks when you want to wire it up yourself
- detection of existing installs so you can see what is already configured
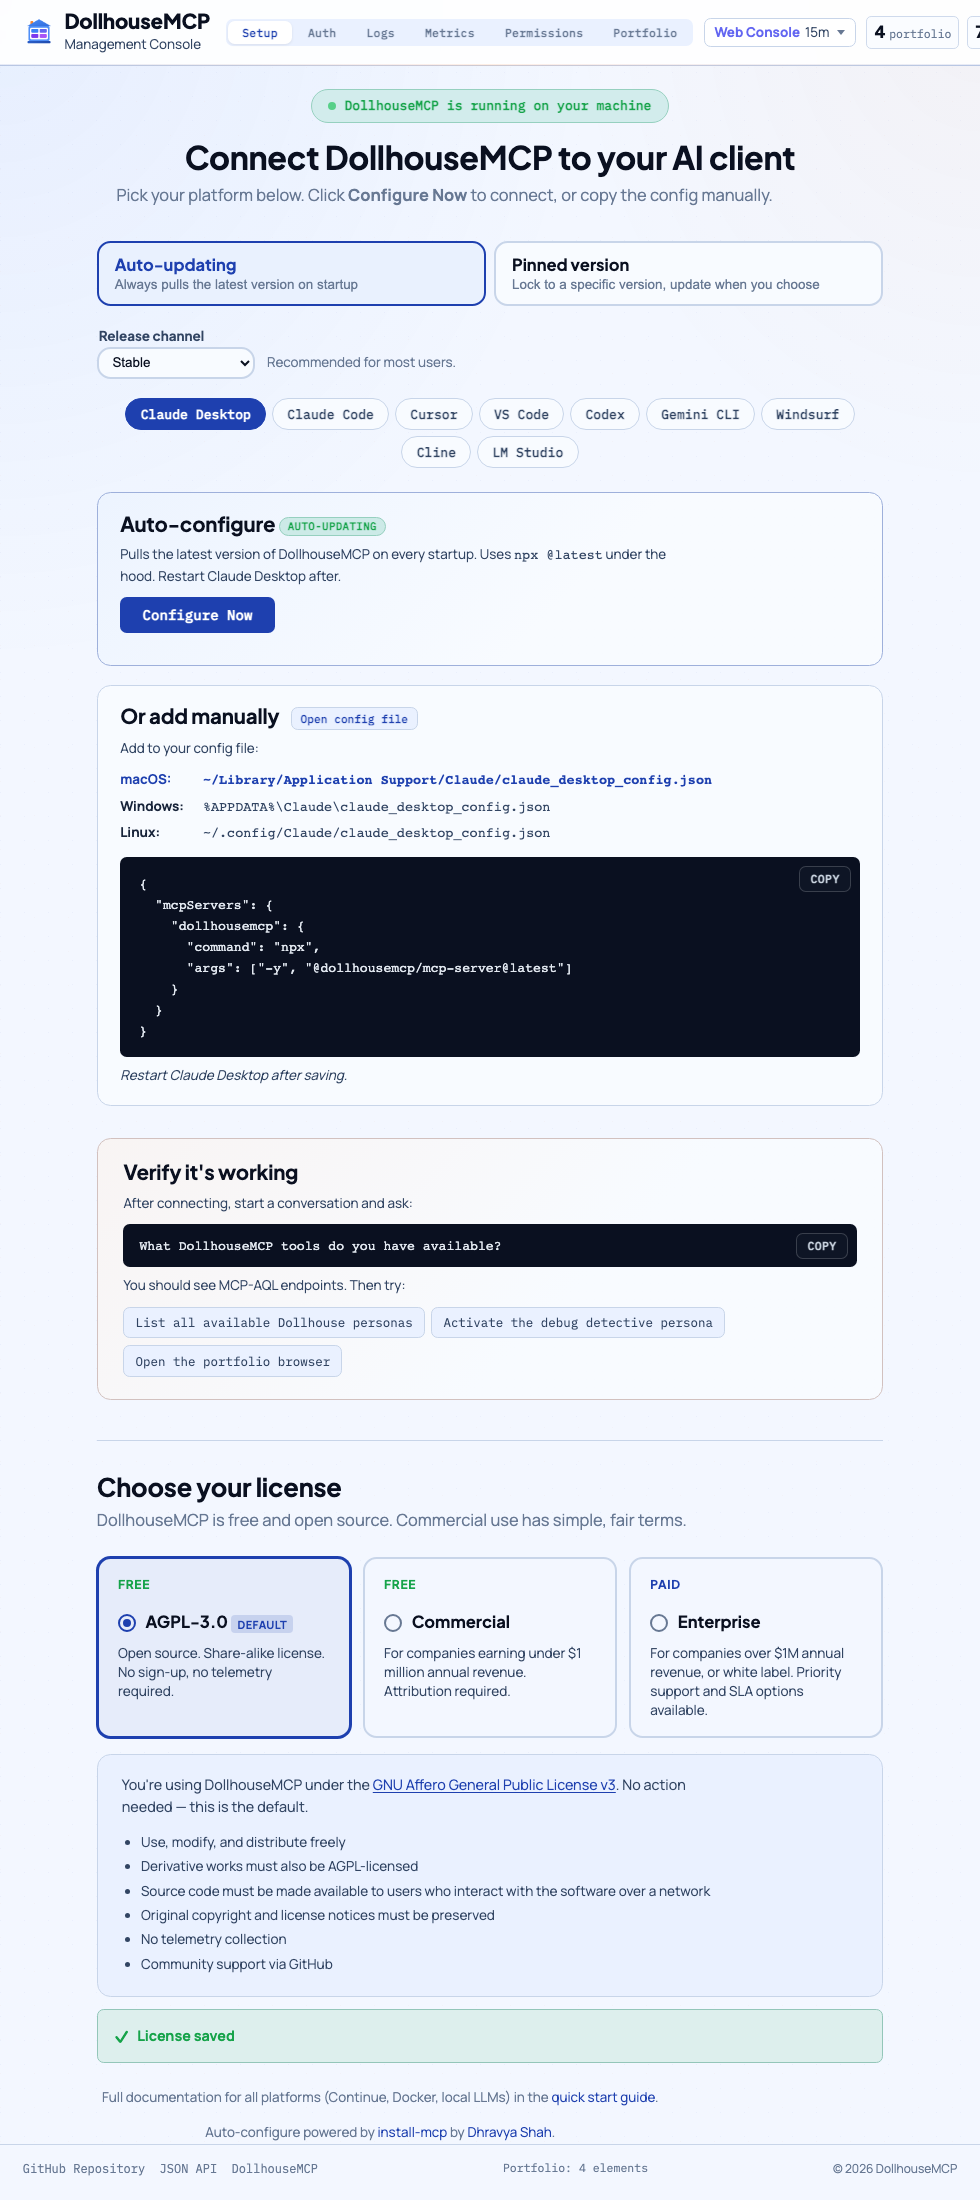
This is also why the new homepage install flow is now centered on the web launcher. It is the easiest on-ramp we have.
Portfolio: Your Local Dollhouse, Rendered
DollhouseMCP elements live in your local portfolio at ~/.dollhouse/portfolio/. The console turns that into a browsable interface so you can search, skim, and inspect what is available without asking the LLM to list everything back to you.
The portfolio browser is especially useful when you already have a meaningful library of elements. You can browse by type, search by name or description, and move between your local portfolio and collection-aware surfaces without leaving the console.
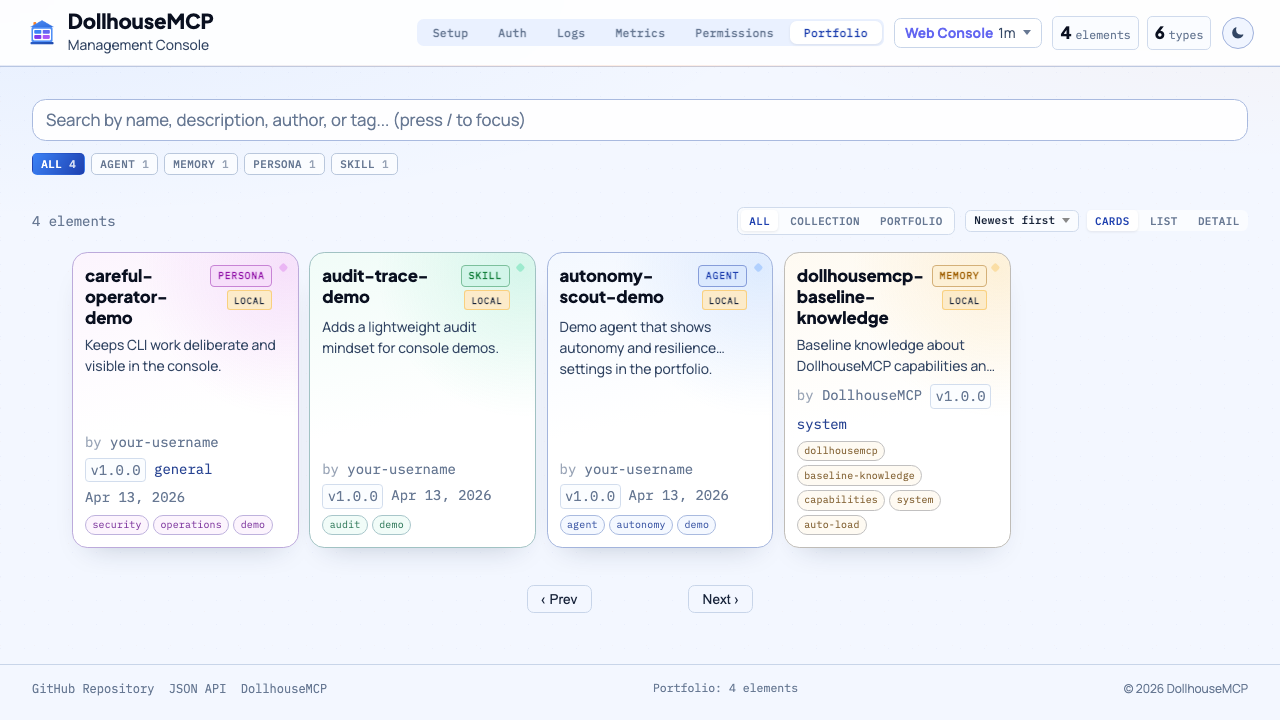
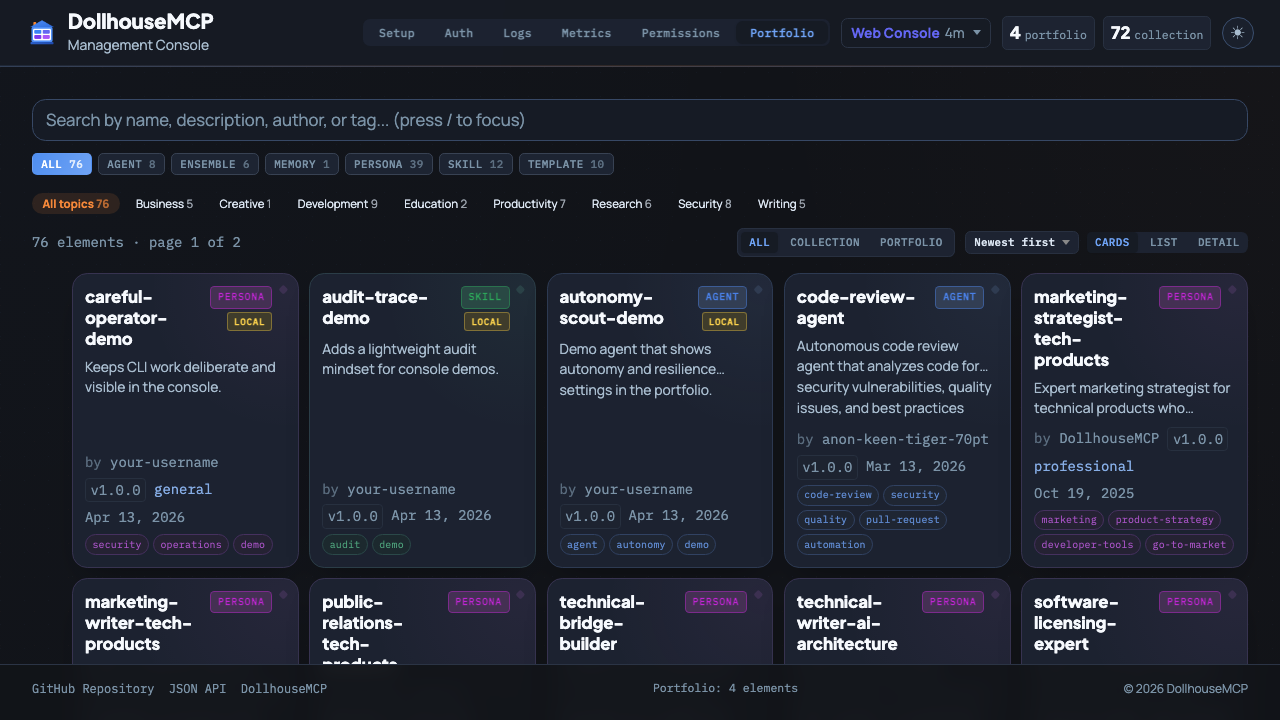
For people new to DollhouseMCP, this tab makes the model of the system much easier to understand: elements are not abstract ideas floating around in a prompt. They are concrete, local building blocks you can browse and manage.
Logs: Real-Time Operational Visibility
The Logs tab is the operational side of the console. According to the public logging guide, the console exposes a browser viewer backed by the same logging system that writes to ~/.dollhouse/logs/.
The logging surface is designed for actual debugging work, not just decoration. The public docs call out capabilities such as:
- category, level, and source filtering
- text search
- pause and resume for streaming
- live updates over Server-Sent Events
- backfill on connect so you are not only seeing brand-new events
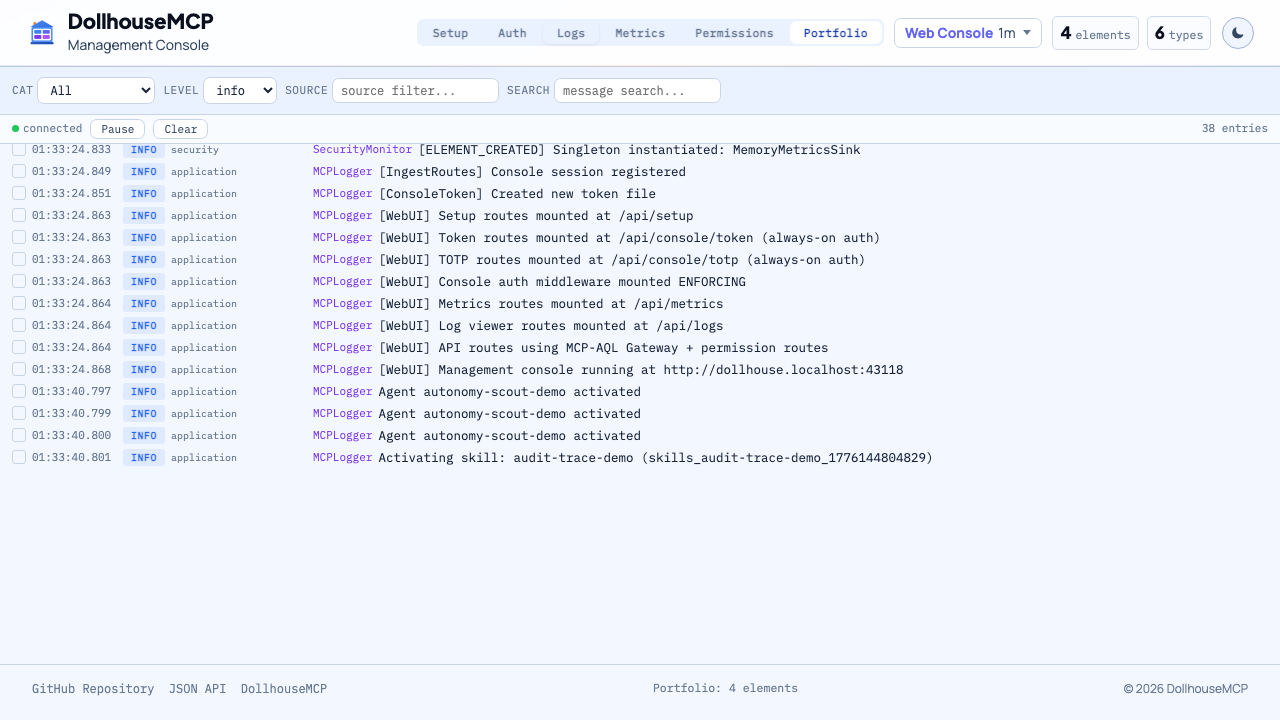
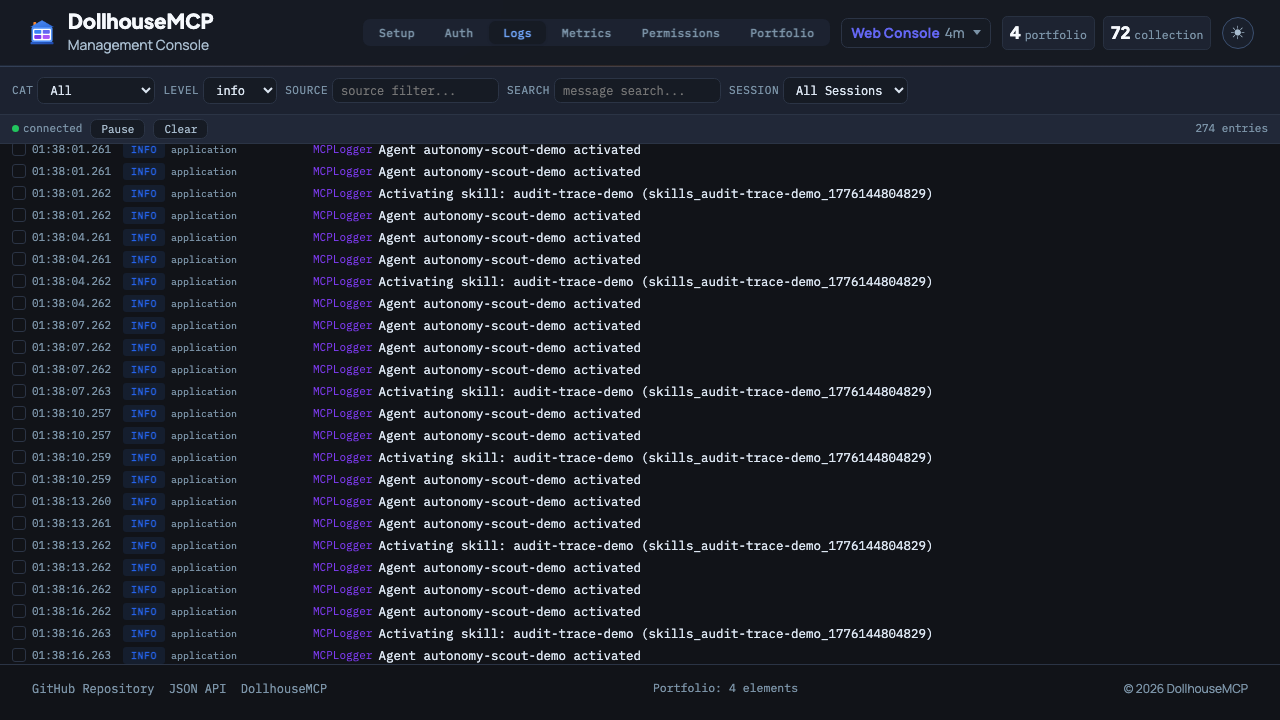
This screenshot shows real startup and activation events from a live console session. That is useful in its own right: the tab is not just a pretty shell, it is already a workable way to confirm that ingestion routes, filters, and severity handling are doing what you expect.
Metrics: What the Server Is Doing Internally
The Metrics tab gives you a higher-level view than raw logs. Instead of individual events, it surfaces the health and behavior of the running server.
The public front-end and docs show metrics cards for things like:
- system health
- search performance
- MCP-AQL operations
- cache efficiency
- security
- Gatekeeper policy trends
- locks and I/O
- metrics system status
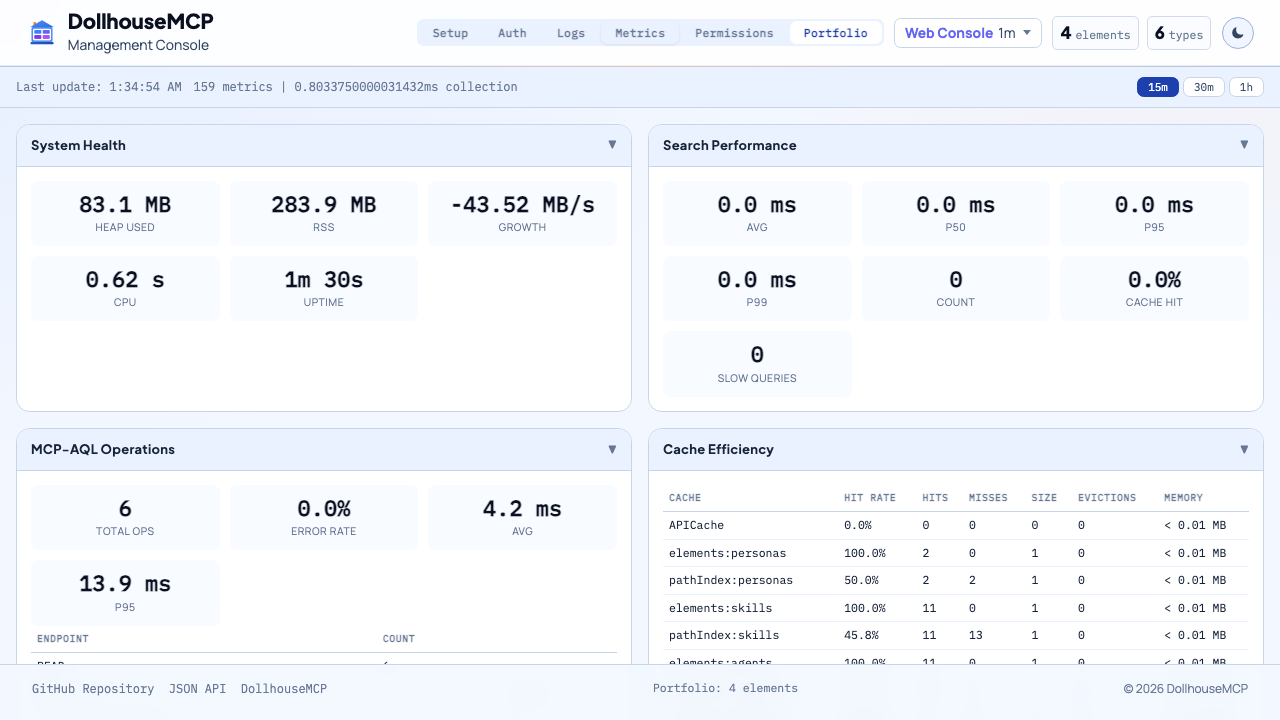
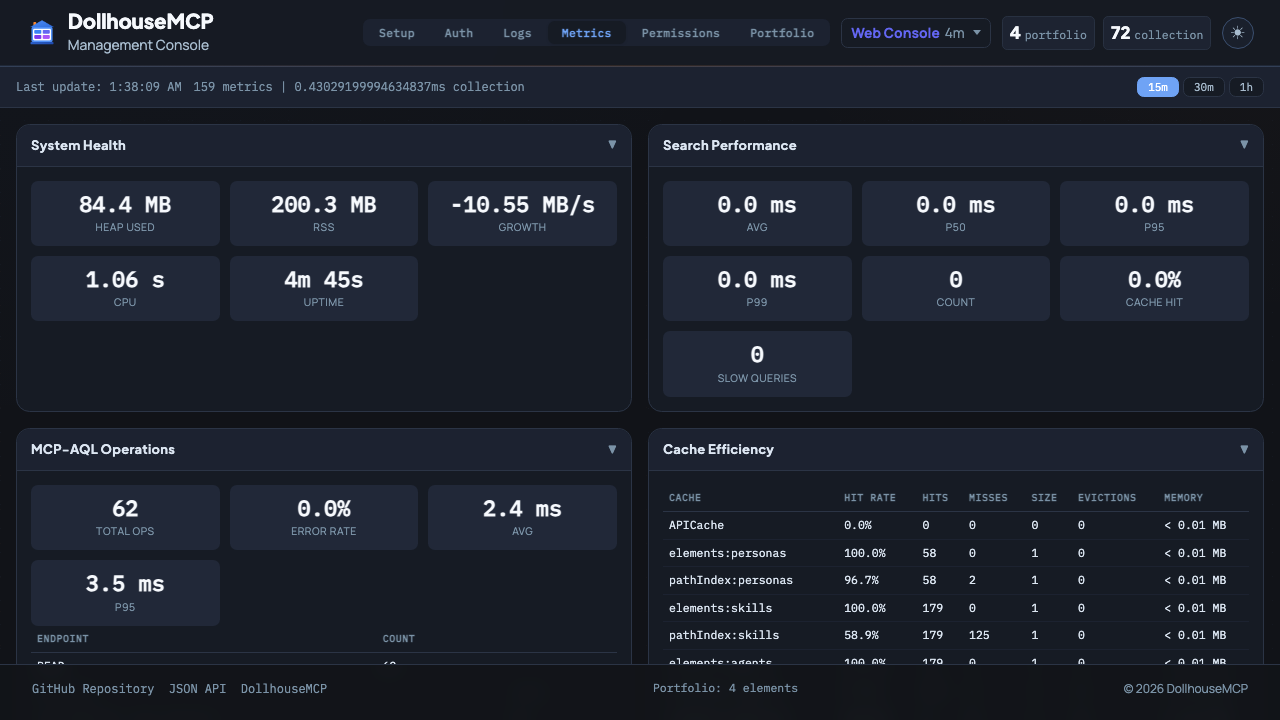
Metrics take a moment to warm up because the first snapshot is collected on an interval after the server starts. Once that first snapshot lands, the dashboard becomes a genuinely useful quick read on memory, CPU, cache activity, security counters, and metrics pipeline health.
Permissions: Making Gatekeeper Visible
The Permissions tab is one of my favorite additions because it makes the Gatekeeper model legible. DollhouseMCP does not treat permissions as an invisible implementation detail. Active elements can change what operations are allowed, denied, or require confirmation, and the console gives you a way to see that state directly.
The public README and docs describe Gatekeeper as a server-side enforcement layer that applies active element policies across MCP-AQL operations. In the console, that becomes tangible:
- current policy sources
- allow patterns
- deny patterns
- confirm patterns
- a live decision feed
- lightweight autonomy and decision counters
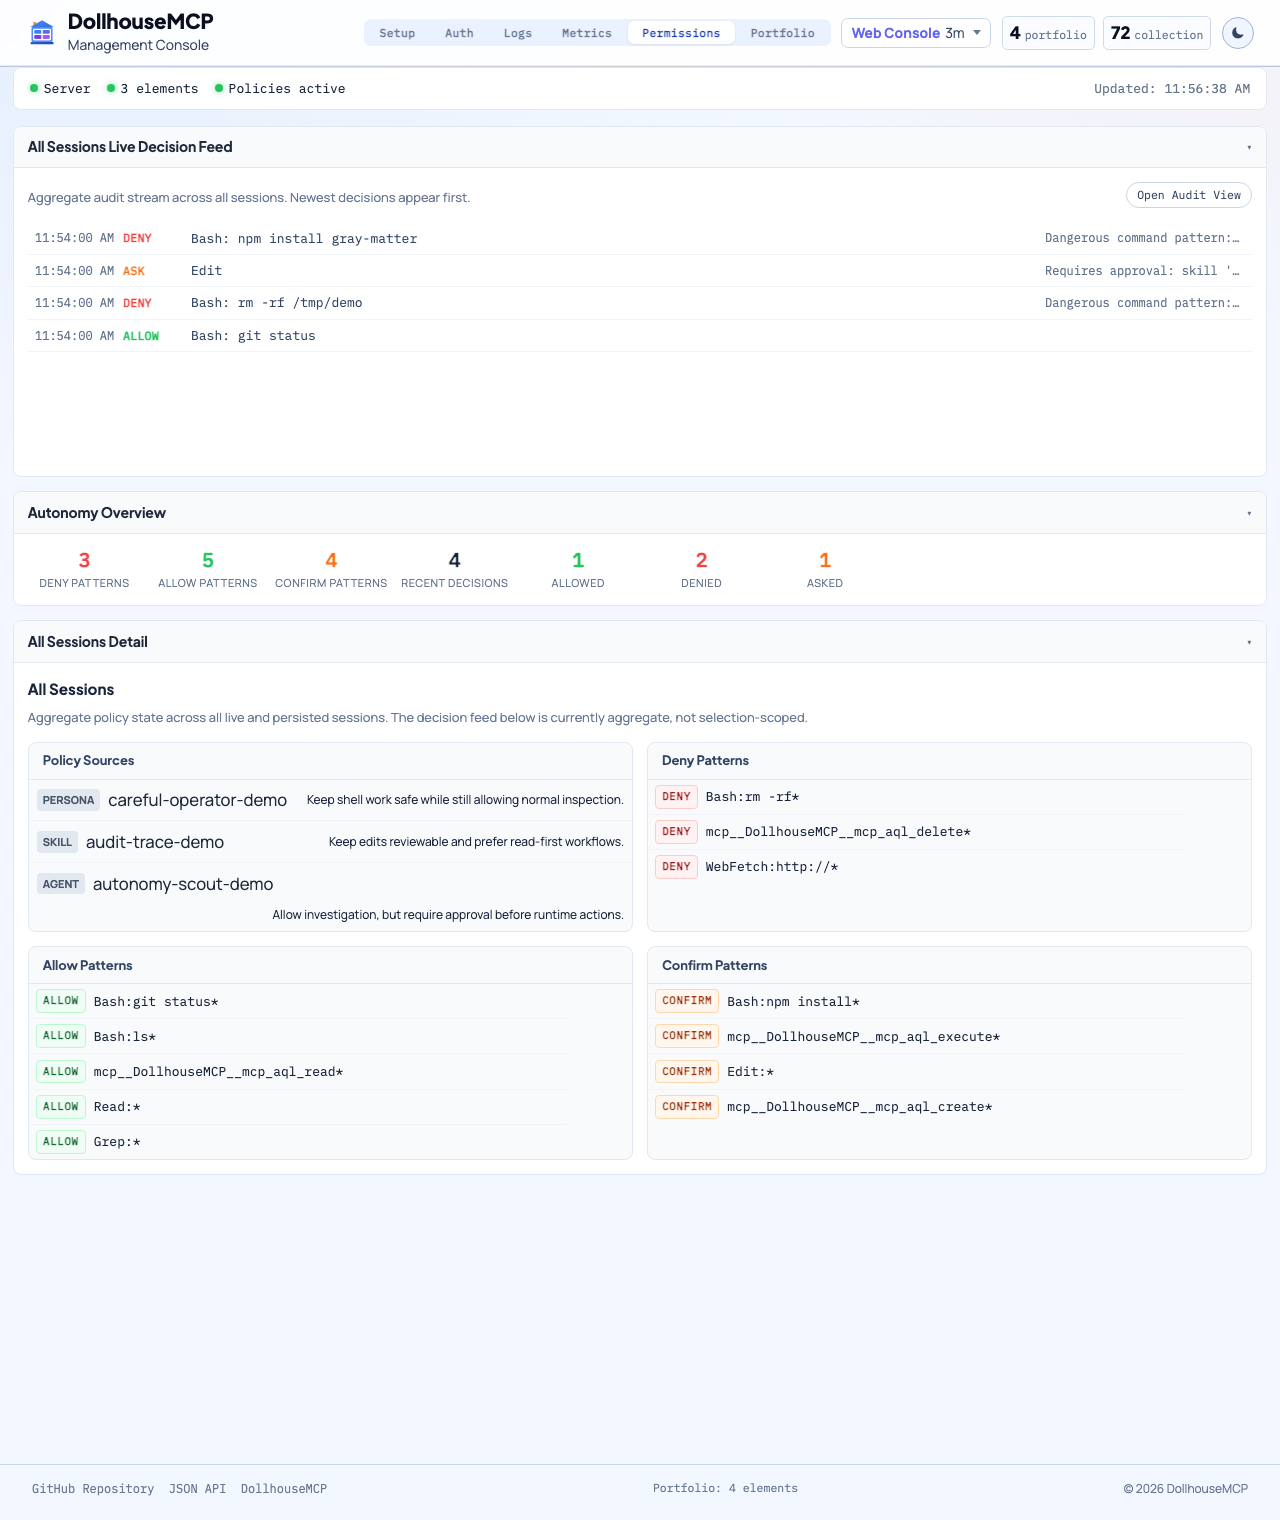
In this capture, the permission sources come from active demo elements with explicit allow, deny, and confirm patterns, so you can see the policy layer and the resulting live decisions side by side.
That visibility matters. If your AI is being shaped by personas, skills, ensembles, and policy-driven workflows, you should be able to inspect the permission layer instead of trusting it blindly.
Why the Console Matters
The console is not the product by itself, but it makes the rest of the platform much easier to understand and operate.
It gives new users a guided starting point, power users a visual portfolio browser, and developers a real debugging and observability surface. Just as importantly, it helps explain what is different about DollhouseMCP: local elements, platform-wide setup, server-side policy enforcement, and a runtime you can actually inspect.
If you have only interacted with DollhouseMCP through MCP tool calls so far, it is worth launching the console and clicking around for a few minutes. It makes the shape of the platform much more obvious.
Try It
Copy this, paste it into a terminal, and run it:
npx @dollhousemcp/mcp-server@latest --web
Then open the local console URL printed by the server and take a look around.